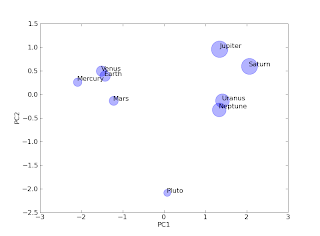
While there a number of tutorials and pages better devoted to the subject of principle component analysis (PCA), this post is geared towards providing a simple example of this data classification method in python. Much of the algorithm code was provided by Henning Risvik. This module along with numpy, scipy, and matplotlib are required for this example to function. The data used for this example are derived from the physical properties of the planets (the debate over Pluto's status is for another post but is assumed to retain it's planet privileges for this post). The pca module required for this example can be found here.
'''
PCA example using python.  Very simplified
'''

import pca_module as pca
import numpy as N
import pylab as P
'''
Adapted from:

http://www.cs.mcgill.ca/~sqrt/dimr/dimreduction.html

[title]  Planets of the Solar System
[source] http://pds.jpl.nasa.gov/planets/

[columns]  distance  diameter  density
"Mercury"    0.387     4878     5.42   (black)
"Venus"      0.723    12104     5.25   (black)
"Earth"      1.000    12756     5.52   (black)
"Mars"       1.524     6787     3.94   (black)
"Jupiter"    5.203   142800     1.314  (blue)
"Saturn"     9.539   120660     0.69   (blue)
"Uranus"    19.18     51118     1.29   (blue)
"Neptune"   30.06     49528     1.64   (blue)
"Pluto"     39.53      2300     2.03   (blue)

'''
RawPlanets = N.array([
              [0.39,4878,5.42],
              [0.72,12104,5.25],
              [1,12756,5.52],
              [1.52,6787,3.94],
              [5.2,142800,1.31],
              [9.54,120660,0.69],
              [19.18,51118,1.29],
              [30.06,49528,1.64],
              [39.53,2300,2.03]])

#Normalize the raw values
dataMatrix = N.log10(RawPlanets)

#perform PCA--thanks Henning Risvik
scores,  loading,  explanation = pca.PCA_nipals2(dataMatrix, standardize=True)

pc1 = scores[:, 0]
pc2 = scores[:, 1]
pc3 = scores[:, 2]

fig=P.figure()#create pylab figure
ax = fig.add_subplot(111)#create an ax

#add scatter plot and size based upon distance from sun
ax.scatter(pc1, pc2, color = 'b', s = dataMatrix[:,1]**4, alpha = 0.3)

#add axis labels
ax.set_xlabel('PC1', fontsize = 12)
ax.set_ylabel('PC2', fontsize = 12)

#data labels
labels = ['Mercury','Venus', 'Earth', 'Mars', 'Jupiter', 'Saturn', 'Uranus', 'Neptune', 'Pluto']
#add labels to each marker
for label, x, y in map(None, labels, pc1, pc2):
    ax.annotate(label, xy=(x, y),  size = 12)

P.show()


